
Functional Diagram, also known as ‘Block Diagram’, offers a flexible and interactive alternative to one of the most essential (and frustrating) tools in the technician’s bag of tricks: wiring diagrams or “schematics”.
Wiring diagrams are essential in diagnosing and maintaining complex electronics systems. They apply to everything from farm and cultivation equipment to aviation—and of course, vehicles.
Until around the 1980s, before the introduction of CAD, wiring diagrams were hand-drawn. We’ve come a long way since then, but still, the traditional methods used to present wiring information—often static and hard to decipher—leave much to be desired for modern technicians. What if instead of clunky and complex, wiring diagrams were visually searchable, easy to understand, build-specific and allowed technicians to isolate circuits according to function or even related trouble codes?
Product Expert Nick Horan explains the ins and outs of wiring diagrams. He explains how the Functional Diagram Team, led by Tweddle Group Director of Product Technical Support Chris Boni, have created a tool to make these diagrams more accessible for OEMs and their technicians, bringing 21st century interactivity to a perennial technician resource.
Nick, thanks for sitting down with us. I think a lot of people will find this conversation insightful, especially those in the automotive and machinery sectors. To start, can you tell us a bit about why wiring diagrams have historically been such a challenge for technicians?
So, traditional wiring diagrams are essentially maps made up of symbols, lines and numbers. While they’re technically correct, they don’t do a good job of connecting that information to the real-world, physical components that technicians are working on. Imagine looking at a schematic and having to trace out every wire, component and connection across multiple diagrams just to find one failure root cause. It’s tedious and error-prone, that whole process, especially when you’re dealing with complex systems like these.

Functional Diagram: Addressing an Age-Old Challenge
Yeah, I’ve seen those diagrams, and they’re certainly tough to decipher.
They might as well be in Braille, right? (laughs).
How does Functional Diagram change that?
Well, for years, you know, technicians had these very esoteric diagrams, but in order to use that data in an efficient way, they’d need more than just the wiring diagram.
To the extent that it’s possible, they’re going to also have to look at the physical wiring, they’re going to be rummaging through other service materials, they’re going to be flipping back and forth between the physical object and multiple reference documents.
On top of that, they also need a pretty strong base of knowledge. They’re going to have to be experienced.
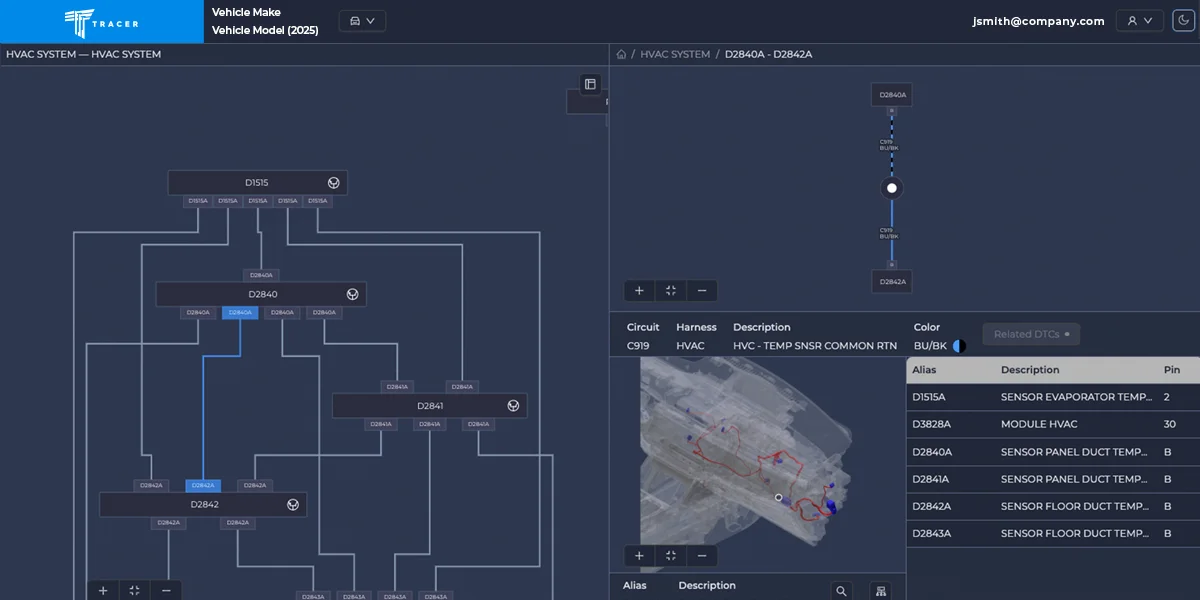
Chris Boni and his team have completely transformed the technician’s interaction with wiring information. Instead of giving them a flat, static document, Functional Diagram presents wiring diagrams in a dynamic, topographical view.
The key here is interactivity. Functional Diagram lets you filter the wiring diagrams based on different parameters—like systems, modules, sensors and even fault codes for up-to-date, vehicle-specific information.
For instance, let’s say you have a diagnostic trouble code (DTC) P0113. With Functional Diagram, you can simply input that DTC, and it’ll filter all circuits related to that specific issue. Suddenly, the technician is presented with a much smaller, more manageable set of diagrams directly relevant to the issue they’re troubleshooting. That means much less training, and much less turnover.
So, it saves time by creating a situation where the technician no longer has to manually sift through hundreds of pages of wiring diagrams?
Exactly. The time saved is massive. In the past, a technician would have to trace through a complex wiring diagram manually, which could take hours. With Functional Diagram, that’s greatly reduced.
Does the platform work in isolation, or do you see it being used in conjunction with other tools?
Other tools, absolutely. It’s not limited to that, but one of its most powerful features is that Functional Diagram pairs perfectly with Wayfinder, our guided diagnostics tool, where Functional Diagram gives technicians the visual context they need to solve the problem. Together, they create an integrated solution that’s not just about finding problems but also understanding them quickly and efficiently.
So, imagine you’re troubleshooting a system, and you get a DTC from TRACER. With Functional Diagram, you can immediately pull up the wiring diagram for that specific fault. It’s a seamless workflow that makes diagnosing and fixing problems much faster and more accurate.
But the really great thing is that it can also stand alone, not tied to any other tools or systems. Functional Diagram is powerful, and it’s dynamic.
For Any Complex System
Let’s step back a bit. Who exactly benefits from this tool? Is it just automotive technicians, or could other industries find this useful as well?
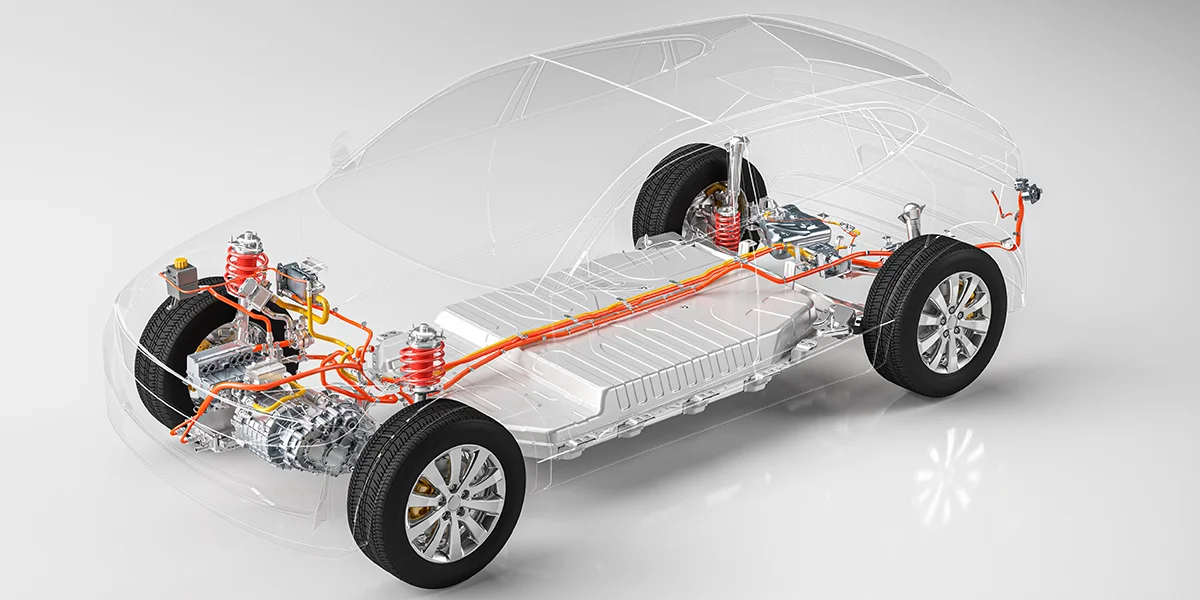
This is not just an automotive solution. It’s built for any industry dealing with complex systems, from industrial machinery all the way to robotics. Basically, if a product has wiring harnesses, modules, sensors or fault codes, it can benefit from Functional Diagram.
We’ve had discussions with OEMs in many sectors, and the response has been overwhelmingly positive. Functional Diagram can drastically reduce downtime for technicians, making maintenance and repair operations more efficient—that’s a win for everyone.
One of the primary motivations for OEMs to adopt Functional Diagrams is to address the balance between technician frustration and satisfaction. As you know, we’re facing a technician shortage. And wiring issues are among the most frustrating aspects of vehicle or machinery maintenance. If OEMs can provide their technicians with a more user-friendly tool, it improves the technician’s experience and ultimately enhances their ability to do the job efficiently.
Beyond that, there’s also a significant cost-saving potential. Traditionally, creating wiring diagrams for a vehicle or piece of equipment is a resource-intensive process. It requires manual development, constant updates and significant engineering effort. With Functional Diagram, OEMs can move away from this traditional, labor-intensive method. Instead, they can ingest existing engineering data, which we then process and convert into interactive wiring diagrams.
So, OEMs can save a lot of money—potentially a hundred thousand dollars per vehicle.
Are these cost savings theoretical at this point, or have you seen any cases where an OEM has already seen this level of benefit?
Those numbers are based on existing, real-world use cases. One OEM we’re working with has implemented the Functional Diagram tool, and they’re seeing great results. They’ve integrated it with their diagnostic platform, and it’s leading to faster repairs and fewer errors.
They’ve saved money on the development side, too. Rather than spending months building and updating traditional wiring diagrams, they’ve shifted to a more efficient process that relies on existing engineering data ingestion. This has already led to a substantial reduction in their overall cost of service.
The situation in question, that OEM was able to reduce development costs from $180,000 per vehicle to as low as $70,000 to $80,000. So, they saved around $100,000.
That’s pretty impressive. Are there any other ways Functional Diagram might provide value from an OEM perspective?
Another huge advantage is the analytics. Traditional wiring diagrams are static documents, meaning once they’re delivered, they’re static, so they don’t provide you with any feedback on root cause frequency or what areas technicians are struggling with the most. In some cases, the wiring diagrams are already out of date by the time the vehicle reaches the dealer. With Functional Diagram, we can track how technicians are interacting with the diagrams. We can gather data on which parts or wiring sections are being accessed the most and even monitor fault code trends.
This data gives OEMs valuable insights. For example, if a particular wiring harness consistently appears in the diagnostics of multiple vehicles, that could indicate a design or manufacturing flaw. The same goes for specific sensors or modules. OEMs can use this intelligence to make data-driven decisions about design improvements, supplier changes or even proactive repairs before a widespread issue occurs.
How easy is it for an OEM to implement Functional Diagram? Is it difficult to integrate a tool like this into their current systems?
Since Functional Diagram is a web-based application, it can be accessed from a device with internet access. Integration with other tools, like Wayfinder, is seamless. OEMs don’t need to overhaul their entire infrastructure to use it. They provide the existing engineering data, and we handle the rest—processing, converting and making it interactive.
Functional Diagrams are a great option for companies looking for a quick, cost-effective way to improve their diagnostic and repair processes without a heavy lift in terms of implementation. This tool is built to scale. Whether you’re working with one vehicle model or a thousand, Functional Diagram handles the complexity in the same way.
Functional Diagram: Wiring Diagrams for the 21st Century
Functional Diagram is a simple solution for OEMs looking to streamline their repair processes, save on development costs and improve overall operational efficiency. If you’re in an industry that relies on complex wiring systems, interactive wiring diagrams offer a simple way to revolutionize relevant operations, making everyday labor more interactive, intuitive and efficient.
Special thanks to Chris Boni for his contribution to this article.
Nick Horan Photographs by Matt Wong